State of Wisconsin
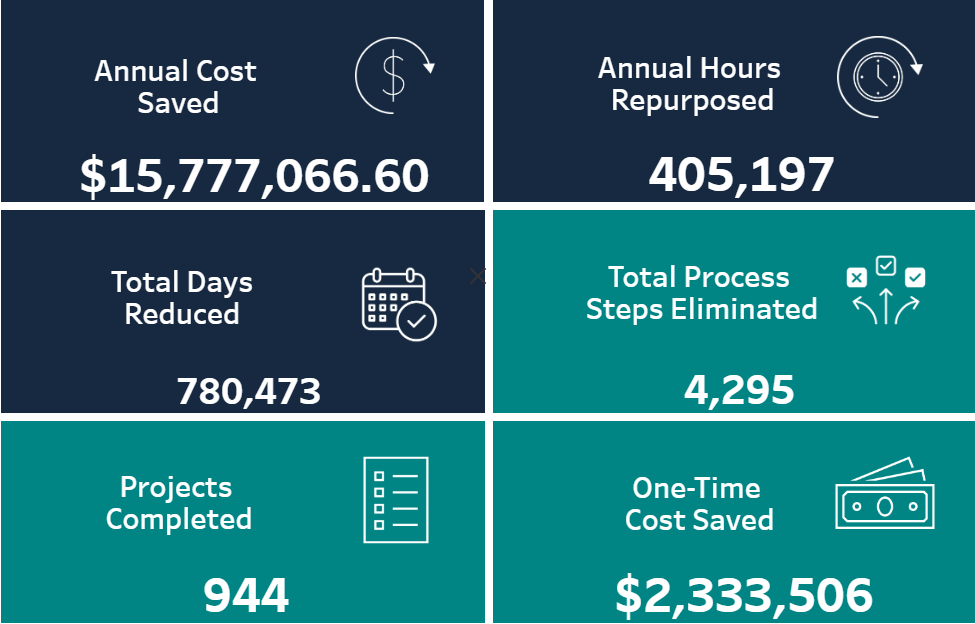
The graphic to the right reflects the total impact of the Enterprise Continuous Improvement program from FY16-26.
For the most up-to-date status of state-wide improvement metrics, view our metrics summary visual on Tableau. For state employees looking for a breakdown of agency and division data, you can view our agency breakdown metrics by logging into Tableau with your state IAM account.
Since reporting improvement efforts is voluntary by our participating agencies, some improvements may not be captured in the displayed data.